
Previous investigations typically looked only at publication bias or questionable research practices QRPs (but not both), used non-representative study-level sample sizes, or only compared few bias-correcting techniques, but not all of them. Our goal was to simulate a research literature that is as realistic as possible for psychology. In order to simulate several research environments, we fully crossed five experimental factors: (1) the true underlying effect, δ (0, 0.2, 0.5, 0.8); (2) between-study heterogeneity, τ (0, 0.2, 0.4); (3) the number of studies in the meta-analytic sample, k (10, 30, 60, 100); (4) the percentage of studies in the meta-analytic sample produced under publication bias (0%, 60%, 90%); and (5) the use of QRPs in the literature that produced the meta-analytic sample (none, medium, high).
This blog post summarizes some insights from our study, internally called “meta-showdown”. Check out the preprint; and the interactive app metaExplorer. The fully reproducible and reusable simulation code is on Github, and more information is on OSF.
In this blog post, I will highlight some lessons that we learned during the project, primarily focusing on what not do to when performing a meta-analysis.
Constraints on Generality disclaimer: These recommendations apply to typical sample sizes, effect sizes, and heterogeneities in psychology; other research literatures might have different settings and therefore a different performance of the methods. Furthermore, the recommendations rely on the modeling assumptions of our simulation. We went a long way to make them as realistic as possible, but other assumptions could lead to other results.
Never trust a naive random effects meta-analysis or trim-and-fill (unless you meta-analyze a set of registered reports)
If studies have no publication bias, nothing can beat plain old random effects meta-analysis: it has the highest power, the least bias, and the highest efficiency compared to all other methods. Even in the presence of some (though not extreme) QRPs, naive RE performs better than all other methods. When can we expect no publication bias? If (and, in my opinion only if) we meta-analyze a set of registered reports.
But.
In any other setting except registered reports, a consequential amount of publication bias must be expected. In the field of psychology/psychiatry, more than 90% of all published hypothesis tests are significant (Fanelli, 2011) despite the average power being estimated as around 35% (Bakker, van Dijk, & Wicherts, 2012) – the gap points towards a huge publication bias. In the presence of publication bias, naive random effects meta-analysis and trim-and-fill have false positive rates approaching 100%:

More thoughts about trim-and-fill’s inability to recover δ=0 are in Joe Hilgard’s blog post. (Note: this insight is not really new and has been shown multiple times before, for example by Moreno et al., 2009, and Simonsohn, Nelson, and Simmons, 2014).
Our recommendation: Never trust meta-analyses based on naive random effects and trim-and-fill, unless you can rule out publication bias. Results from previously published meta-analyses based on these methods should be treated with a lot of skepticism.
Do not use p-curve to estimate the mean of all conducted studies under heterogeneity (it is not intended to do that)
Update 2017/06/09: We had a productive exchange with Uri Simonsohn and Joe Simmons concerning what should be estimated in a meta-analysis with heterogeneity. Traditionally, meta-analysts have tried to arrive at techniques that recover the true average effect of all conducted studies (AEA – average effect of all studies). Simonsohn et al (2014) propose estimating a different magnitude; the average effect of the studies one observes, rather than of all studies (AEO – average effect of observed studies). See Simonsohn et al (2014), the associated Supplementary Material 2, and also this blog post for arguments why they think this is a more useful quantity to estimate.
Hence, an investigation of the topic can be done on two levels: A) What is the more appropriate estimand (AEA or AEO?), and B) Under what conditions are estimators able to recover the respective true value with the least bias and least variance?
Instead of updating the section of the current blog post in the light of our discussion, I decided to cut it out and to move the topic to a future blog post. Likewise, one part of our manuscript’s revision will be a more detailed discussion about excatly these differences.
I archived the previous version of the blog post here.
Ignore overadjustments in the opposite direction
Many bias-correcting methods are driven by QRPs – the more QRPs, the stronger the downward correction. However, this effect can get so strong, that methods overadjust into the opposite direction, even if all studies in the meta-analysis are of the same sign:

Note: You need to set the option “Keep negative estimates” to get this plot.
Our recommendation: Ignore bias-corrected results that go into the opposite direction; set the estimate to zero, do not reject H₀.
Do not take it seriously if PET-PEESE does a reverse correction
Typical small-study effects (e.g., by p-hacking or publication bias) induce a negative correlation between sample size and effect size – the smaller the sample, the larger the observed effect size. PET-PEESE aims to correct for that relationship. In the absence of bias and QRPs, however, random fluctuations can lead to a positive correlation between sample size and effect size, which leads to a PET and PEESE slope of the unintended sign. Without publication bias, this reversal of the slope actually happens quite often.
See for example the next figure. The true effect size is zero (red dot), naive random effects meta-analysis slightly overestimates the true effect (see black dotted triangle), but PET and PEESE massively overadjust towards more positive effects:

As far as I know, PET-PEESE is typically not intended to correct in the reverse direction. An underlying biasing process would have to systematically remove small studies that show a significant result with larger effect sizes, and keep small studies with non-significant results. In the current incentive structure of psychological research, I see no reason for such a process, unless researchers are motivated to show that a (maybe politically controversial) effect does not exist.
Our recommendation: Ignore the PET-PEESE correction if it has the wrong sign, unless there are good reasons for an untypical selection process.
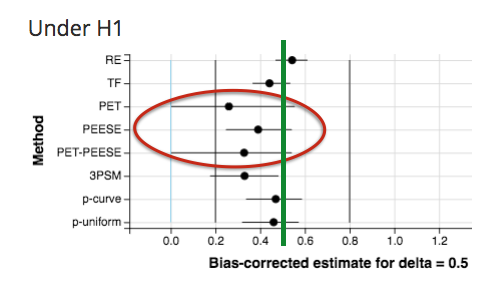
PET-PEESE sometimes overestimates, sometimes underestimates
A bias can be more easily accepted if it always is conservative – then one could conclude: “This method might miss some true effects, but if it indicates an effect, we can be quite confident that it really exists”. Depending on the conditions (i.e., how much publication bias, how much QRPs, etc.), however, PET/PEESE sometimes shows huge overestimation and sometimes huge underestimation.
For example, with no publication bias, some heterogeneity (τ=0.2), and severe QRPs, PET/PEESE underestimates the true effect of δ = 0.5:

In contrast, if no effect exists in reality, but strong publication bias, large heterogeneity and no QRPs, PET/PEESE overestimates at lot:

In fact, the distribution of PET/PEESE estimates looks virtually identical for these two examples, although the underlying true effect is δ = 0.5 in the upper plot and δ = 0 in the lower plot. Furthermore, note the huge spread of PET/PEESE estimates (the error bars visualize the 95% quantiles of all simulated replications): Any single PET/PEESE estimate can be very far off.
Our recommendation: As one cannot know the condition of reality, it is probably safest not to use PET/PEESE at all.
Recommendations in a nutshell: What you should not use in a meta-analysis
Again, please consider the “Constraints on Generality” disclaimer above.
- When you can exclude publication bias (i.e., in the context of registered reports), do not use bias-correcting techniques. Even in the presence of some QRPs they perform worse than plain random effects meta-analysis.
- In any other setting except registered reports, expect publication bias, and do not use random effects meta-analysis or trim-and-fill. Both will give you a 100% false positive rate in typical settings, and a biased estimation.
- Even if all studies entering a meta-analysis point into the same direction (e.g., all are positive), bias-correcting techniques sometimes overadjust and return a significant estimate of the opposite direction. Ignore these results, set the estimate to zero, do not reject H₀.
- Sometimes PET/PEESE adjust into the wrong direction (i.e., increasing the estimated true effect size)
As with any general recommendations, there might be good reasons to ignore them.
Additional technical recommendations
- The p-uniform package (v. 0.0.2) very rarely does not provide a lower CI. In this case, ignore the estimate.
- Do not run p-curve or p-uniform on <=3 significant and directionally consistent studies. Although computationally possible, this gives hugely variable results, which are often very biased. See our supplemental material for more information and plots.
- If the 3PSM method (in the implementation of McShane et al., 2016) returns an incomplete covariance matrix, ignore the result (even if a point estimate is provided).
2 thoughts on “Correcting bias in meta-analyses: What not to do (meta-showdown Part 1)”