

[This is a guest post by Ned Bicare, PhD]
My dear fellow scientists!
“If you torture the data long enough, it will confess.”
This aphorism, attributed to Ronald Coase, sometimes has been used in a disrespective manner, as if it was wrong to do creative data analysis.
In fact, the art of creative data analysis has experienced despicable attacks over the last years. These people propagate stupid method repetitions; and what was once one of the supreme disciplines of scientific investigation – a creative data analysis of a data set – has been crippled to conducting an empty-headed step-by-step pre-registered analysis plan.
They claim that p-hacking leads to more significant results, and that researchers who use p-hacking have higher chances of getting things published.
What are the consequence of these findings? The answer is clear. Everybody should be equipped with these powerful tools of research enhancement!
The art of creative data analysis
Some researchers describe a performance-oriented data analysis as “data-dependent analysis”. We go one step further, and call this technique data-optimal analysis (DOA), as our goal is to produce the optimal, most significant outcome from a data set.
I developed an online app that allows to practice creative data analysis and how to polish your p-values. It’s primarily aimed at young researchers who do not have our level of expertise yet, but I guess even old hands might learn one or two new tricks! It’s called “The p-hacker”. You can use the app in teaching, or to practice p-hacking yourself.
The full R code for this Shiny app is on Github.
Train your p-hacking skills: Introducing the p-hacker app
Here’s a quick walkthrough of the app. Please see also the quick manual at the top of the app for more details.
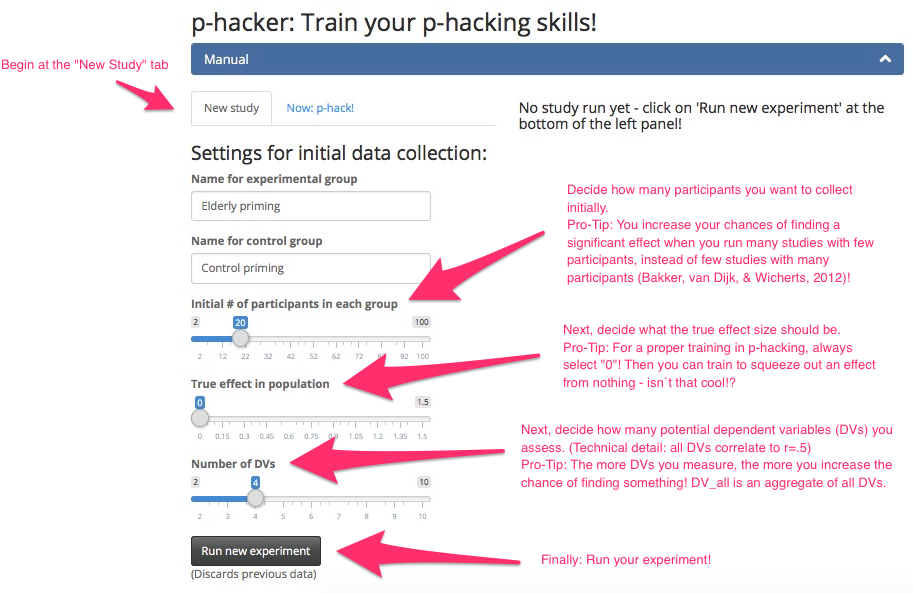
First, you have to run an initial study in the “New study” tab:
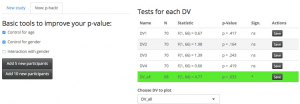
When you ran your first study, inspect the results in the middle pane. Let’s take a look at our results, which are quite promising:

After exclusion of this obvious outlier, your first study is already a success! Click on “Save” next to your significant result to save the study to your study stack on the right panel:

Sometimes outlier exclusion is not enough to improve your result.
Now comes the magic. Click on the “Now: p-hack!” tab – this gives you all the great tools to improve your current study. Here you can fully utilize your data analytic skills and creativity.
In the following example, we could not get a significant result by outlier exclusion alone. But after adding 10 participants (in two batches of 5), controlling for age and gender, and focusing on the variable that worked best – voilà!
Do you see how easy it is to craft a significant study?
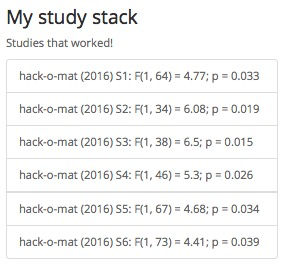
Now it is important to show even more productivity: Go for the next conceptual replication (i.e., go back to Step 1 and collect a new sample, with a new manipulation and a new DV). Whenever your study reached significance, click on the Save button next to each DV and the study is saved to your stack, awaiting some additional conceptual replications that show the robustness of the effect. Many journals require multiple studies. Four to six studies should make a compelling case:
Honor to whom honor is due: Find the best outlet for your achievements!
My friends, let’s stand together and Make Psychological Science Great Again! I really hope that the p-hacker app can play its part in bringing psychological science back to its old days of glory.

Best regards,
Ned Bicare, PhD
PS: A similar app can be found on FiveThirtyEight: Hack Your Way To Scientific Glory
Great post. One way to improve it would be to give a background on the experiment the app is simulating.
For examples, what does DV stands for? What method are you using to analyze the data (control group/experimental group)? How did u generate/simulate the observation (normal random samples, ….) etc
Cheers
All we need now is a Bayes version.
Awesome guys. Thanks for sharing.
Cool post, thank you! =]