
If the p-value is < .05, then the probability of falsely rejecting the null hypothesis is <5%, right? That means, a maximum of 5% of all significant results is a false-positive (that’s what we control with the α rate).
Well, no. As you will see in a minute, the “false discovery rate” (aka. false-positive rate), which indicates the probability that a significant p-value actually is a false-positive, usually is much higher than 5%.
A common misconception about p-values
Oakes (1986) asked the following question to students and senior scientists:
You have a p-value of .01. Is the following statement true, or false?
You know, if you decide to reject the null hypothesis, the probability that you are making the wrong decision.
The answer is “false” (you will learn why it’s false below). But 86% of all professors and lecturers in the sample who were teaching statistics (!) answered this question erroneously with “true”. Gigerenzer, Kraus, and Vitouch replicated this result in 2000 in a German sample (here, the “statistics lecturer” category had 73% wrong). Hence, it is a wide-spread error to confuse the p-value with the false discovery rate.
The False Discovery Rate (FDR) and the Positive Predictive Value (PPV)
To answer the question “What’s the probability that a significant p-value indicates a true effect?”, we have to look at the positive predictive value (PPV) of a significant p-value. The PPV indicates the proportion of significant p-values which indicate a real effect amongst all significant p-values. Put in other words: Given that a p-value is significant: What is the probability (in a frequentist sense) that it stems from a real effect?
(The false discovery rate simply is 1-PPV: the probability that a significant p-value stems from a population with null effect).
That is, we are interested in a conditional probability Prob(effect is real | p-value is significant).
Inspired by Colquhoun (2014) one can visualize this conditional probability in the form of a tree-diagram (see below). Let’s assume, we carry out 1000 experiments for 1000 different research questions. We now have to make a couple of prior assumptions (which you can make differently in the app we provide below). For now, we assume that 30% of all studies have a real effect and the statistical test used has a power of 35% with an α level set to 5%. That is of the 1000 experiments, 300 investigate a real effect, and 700 a null effect. Of the 300 true effects, 0.35*300 = 105 are detected, the remaining 195 effects are non-significant false-negatives. On the other branch of 700 null effects, 0.05*700 = 35 p-values are significant by chance (false positives) and 665 are non-significant (true negatives).
This path is visualized here (completely inspired by Colquhoun, 2014):
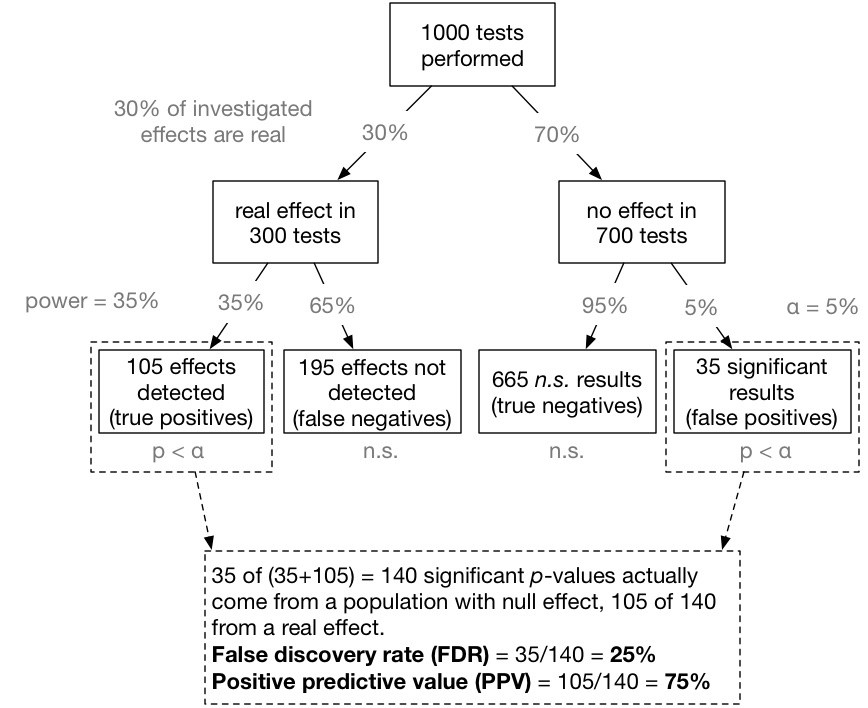
Now we can compute the false discovery rate (FDR): 35 of (35+105) = 140 significant p-values actually come from a null effect. That means, 35/140 = 25% of all significant p-values do not indicate a real effect! That is much more than the alleged 5% level (see also Lakens & Evers, 2014, and Ioannidis, 2005)
An interactive app
Together with Michael Zehetleitner I developed an interactive app that computes and visualizes these numbers. For the computations, you have to choose 4 parameters.
Let’s go through the settings!
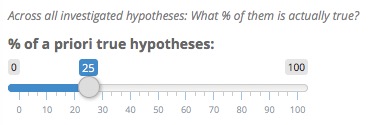
Some of our investigated hypotheses are actually true, and some are false. As a first parameter, we have to estimate what proportion of our investigated hypotheses is actually true.
Now, what is a good setting for the a priori proportion of true hypotheses? It’s certainly not near 100% – in this case only trivial and obvious research questions would be investigated, which is obviously not the case. On the other hand, the rate can definitely drop close to zero. For example, in pharmaceutical drug development “only one in every 5,000 compounds that makes it through lead development to the stage of pre-clinical development becomes an approved drug” (Wikipedia). Here, only 0.02% of all investigated hypotheses are true.
Furthermore, the number depends on the field – some fields are highly speculative and risky (i.e., they have a low prior probability), some fields are more cumulative and work mostly on variations of established effects (i.e., in these fields a higher prior probability can be expected).
But given that many journals in psychology exert a selection pressure towards novel, surprising, and counter-intuitive results (which a priori have a low probability of being true), I guess that the proportion is typically lower than 50%. My personal grand average gut estimate is around 25%.
(Also see this comment and this reply for a discussion about this estimate).
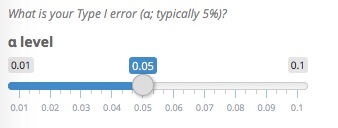
That’s easy. The default α level usually is 5%, but you can play with the impact of stricter levels on the FDR!
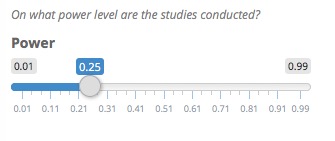
The average power in psychology has been estimated at 35% (Bakker, van Dijk, & Wicherts, 2012). An median estimate for neuroscience is at only 21% (Button et al., 2013). Even worse, both estimates can be expected to be inflated, as they are based on the average published effect size, which almost certainly is overestimated due to the significance filter (Ioannidis, 2008). Hence, the average true power is most likely smaller. Let’s assume an estimate of 25%.
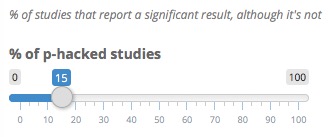
Finally, let’s add some realism to the computations. We know that researchers employ “researchers degrees of freedom”, aka. questionable research practices, to optimize their p-value, and to push a “nearly significant result” across the magic boundary. How many reported significant p-values would not have been significant without p-hacking? That is hard to tell, and probably also field dependent. Let’s assume that 15% of all studies are p-hacked, intentionally or unintentionally.
When these values are defined, the app computes the FDR and PPV and shows a visualization:
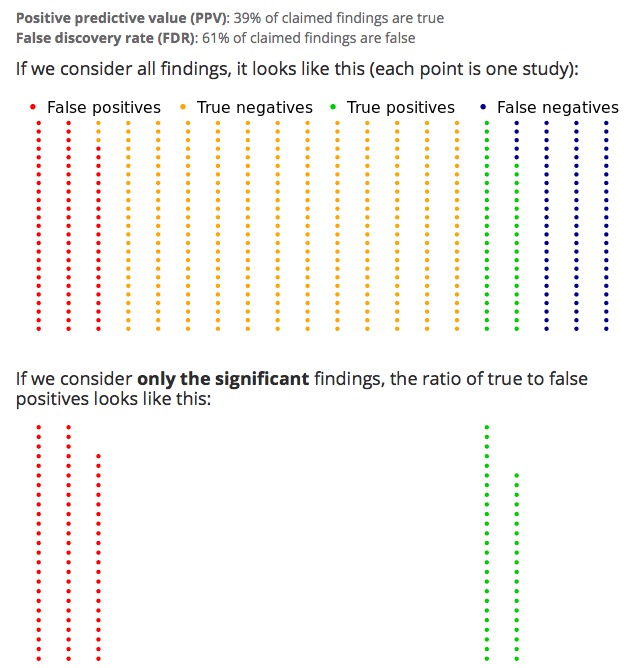
With these settings, only 39% of all significant studies are actually true!
Wait – what was the success rate of the Reproducibility Project: Psychology? 36% of replication projects found a significant effect in a direct replication attempt. Just a coincidence? Maybe. Maybe not.
The formulas to compute the FDR and PPV are based on Ioannidis (2005: “Why most published research findings are false” Note that the published PDF has an error in one formula; see comments at PLOS). A related, but different approach, was proposed by David Colquhoun in his paper “An investigation of the false discovery rate and the misinterpretation of p-values” [open access]. He asks: “How should one interpret the observation of, say, p=0.047 in a single experiment?”. The Ioannidis approach implemented in the app, in contrast, asks: “What is the FDR in a set of studies with p <= .05 and a certain power, etc.?”. Both approaches make sense, but answer different questions.
Other resources about PPV and FDR of p-values
- See also Daniel Laken’s blog post about the same topic, and the interesting discussion below it.
- Will Gervais also wrote a blog post on the topic and also has a cool interactive app which displays the results in another style.
- Commenter SamGG pointed to another publication which has illuminating graphics:
Krzywinski, M., & Altman, N. (2013). Points of significance: Power and sample size. Nature Methods, 10, 1139–1140. doi:10.1038/nmeth.2738
Great post! There’s a typo in the tree diagram: in the calculation of the PPV, the divisor is 140, not 40.
Thanks! Corrected.
But NOT corrected here — http://www.r-bloggers.com/whats-the-probability-that-a-significant-p-value-indicates-a-true-effect/. Thanks.
Unfortunately, that’s not possible. R-Bloggers copies the blog post when it aggregates it, but does not update it …
This is nicely illustrated. Paul Smaldino and I published a version of these calculations that includes replication and publication bias: http://journals.plos.org/plosone/article?id=10.1371/journal.pone.0136088. Can use it to calculate Prob(True|number of replications), for example.
This is nice in terms of discussing the FDR but the opening is problematic. Oakes (1986) (not Oates) wasn’t hinging the question on the FDR but on the misinterpretation that the p-value = alpha. This analysis actually answers a different question because it’s about the rate of false positives in the population of published works, not the probability I’m making a Type I error in my study, which is still alpha.
I agree.
The post was basically about how the p-value in the question is wrong which is definitely not the intended answer. (“HAHA, the question was wrong, sucker!”, doesn’t make for a good quiz)
🙂
> not Oates
Thanks for pointing out the typo.
Concerning the Oakes question:
What both have in common is that many researchers confuse p(Data | H0) with p(H0 | Data). Both the (wrong) answer in the question and the answer about FDR are probabilities of hypotheses, which often are tried to be inferred from a probability of data given a hypothesis.
But you are right: the introductory example does not fit perfectly to that what follows. I will think about it.
Actually, Oakes’ question #4 might be a better fit:
“You can deduce the probability of the experimental hypothesis being true.”
Interesting article.
So the rule “reject the null hypothesis if p < alpha" is wrong?
Well… may be. Depends on what you were taught about confidence intervals, p-value, sampling, and experiments. Strictly speaking, as I was taught, the CI and p-value are referenced to the experiment’s design: out of 100 identical experiments, how many will capture the true value in the CI? In that view, neither the p-value nor CI refer to any single experiment/observational study.
An interesting quote from the Wiki ( https://en.wikipedia.org/wiki/Type_I_and_type_II_errors#Etymology )
“… as Florence Nightingale David remarked, “it is necessary to remember the adjective ‘random’ [in the term ‘random sample’] should apply to the method of drawing the sample and not to the sample itself”. ”
Whether the Bayesians have it better is another topic.
Nice post and application.
To be noticed, the figure and article published in Nature
http://www.nature.com/nmeth/journal/v10/n12/fig_tab/nmeth.2738_F1.html
from
Points of significance: Power and sample size
http://www.nature.com/nmeth/journal/v10/n12/full/nmeth.2738.htmlPower and sample size
from
Points of Significance
http://www.nature.com/collections/qghhqm/pointsofsignificance
Best.
Sorry, the second link is
http://www.nature.com/nmeth/journal/v10/n12/full/nmeth.2738.html
also The Economist had a figure very similar to the example used here – see http://www.economist.com/news/briefing/21588057-scientists-think-science-self-correcting-alarming-degree-it-not-trouble
Thanks! I wasn’t aware of this paper. I included it in the post.
Nice post and nice illustration. In terms of the Nature Methods article linked above, it’s a bit of a shame that the caption to Figure 1 mentions underpowered studies. If the majority of effects we are testing don’t really exist – say only 5% of them – then even with a statistical power of 0.95, the FDR is 50%!
So let’s say we have a huge (and ever increasing number) of researchers desperately trying to get that cool effect so that they can get published in Science/Nature. And let’s say that the underlying, *mechanistic* theory behind their hypothesised effect is, shall we say, very shaky (i.e. they *think*, based on some wordy theory, that there might be an effect). How many of those researchers will be searching for an effect that really exists? I think 5% is quite within the bounds of reason. In which case, even amongst studies with a very high statistical power, there’s a 50% chance that the exciting, remarkable effect that got published in Science/Nature is false.
Increasing statistical power (while always a good idea) won’t help in this case. What will help are: i) better understanding of mechanisms that allow for more realistic hypotheses, ii) use of better statistics than standard NHST, and iii) replication (in the case I mention, you would need to show 5 successive replications to achieve an FDR < 0.05).
Reader Mark Lomas drew a mosaic plot of the example’s results:

Good post, but this seems unlikely: “On the other hand, the rate can definitely drop close to zero. For example, in pharmaceutical drug development “only one in every 5,000 compounds that makes it through lead development to the stage of pre-clinical development becomes an approved drug” (Wikipedia). Here, only 0.02% of all investigated hypotheses are true.” Drug approval depends on factors other than whether there is a true effect (cost, size of effect and patient safety being good examples).
Right – many of these 5000 compounds are not actual false-positives, but drop out for other reasons. But even if the rate of working compounds is 100x higher, the a priori rate still is at a meager 2%. (“meager” WRT to the consequences for the PPV).
Hence: Maybe these specific numbers are exaggerated, but I think one can still make the point that there are many reasonable scientific scenarios where the a priori rate of H1 being true gets close to zero.
(Ioannidis, 2005, for example sets the rate for “Discovery-oriented exploratory research with massive testing” at 0.01%)
Very nice post. What I take away is that what calculation you make depends precisey on what question you want to answer. Oakes’s question is, in this context, distressingly imprecise. So, as I recall from my (distant) statstics course is that the the usual (what you call wrong) interpretation of the p-value is something like: the chance of rejecting the null when the null is true (or sometimes, type I error). So, the entire right branch of your decision tree is chopped off, and you get the same answer as the textbook answer. If people were interpreting Oakes’s question this way, and I think that is one perfectly reasonable interpretation of the vague question, then they were right, not wrong. You claim this interpretation is essentially trivial, but again it depends on the question, as psyachoskeptic and others have already noted. I am not a statistician, but I think the question is a reasonable one.
That said, it is all to easy to let that question slip into: Is the null true? or Is the null false? Your post is a great illustration of the pitfalls of making this very common slip, and has sound suggestions on how to deal with the problem.
Thanks again for the post.
A late reply and probably missing a point: It is a great post and highly instructive. However, it hinges on having a share of real effects in 1000 studies. When I read the initial quote, I was thinking of a single study, not of 1000, and a single relationship for which the effect is either real or not. If you do 1000 studies on how listening to country music is related to suicide (came across this thanks to Lakens), then the effect of country music is real or not (probably not) and your tree diagram does not apply. If country music has no effect different from 0, then all significant results are false positives. You can apply the diagram, of course, but you end with 100% and 0%. It would be different if you were having 1000 studies, some of which test country music and others test different music genres for which there might be an effect. Is this correct?
Hello. This app seems to be amazing. However, I am having troubles to make it work. I’ve tried 4 different browsers in 2 different laptops (Mac and PC) and it doesn’t seem to work for me (the screen is in grey colour and shifting the sliders doesn’t change anything). Would have any advice on what I could do to make it work, please? This would be of a massive help.
Thanks very much,
All the best,
Some universities block port 3838, which is needed for Shiny apps. Did you also try it from home?